How Much Does Car Insurance Cost in the USA in 2026?

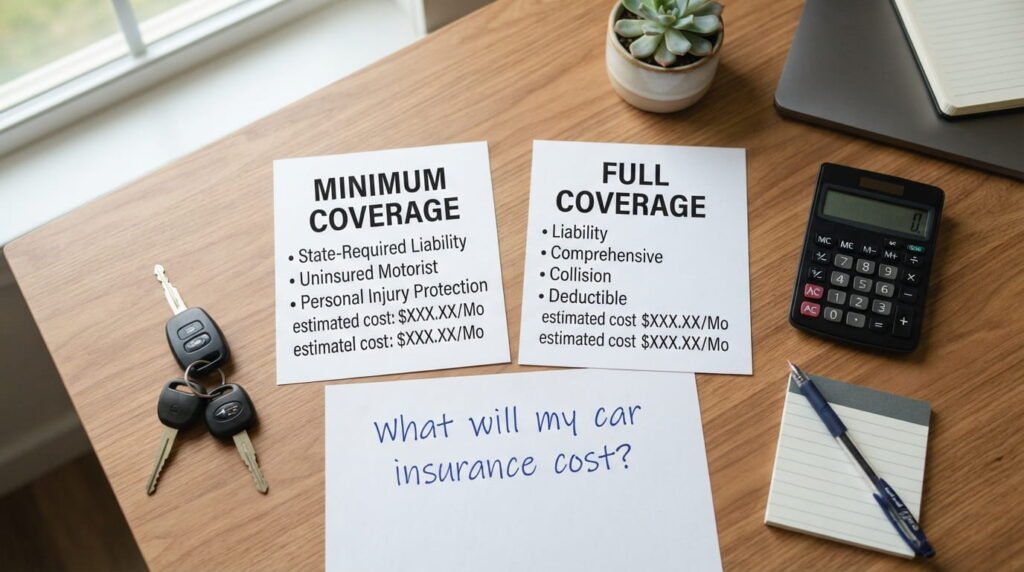
Before buying a car or renewing a policy, it helps to know whether an insurance quote is broadly in line with published prices. But how much does car insurance cost in the USA in 2026? There is no single price for every driver. Your state and ZIP code, driving history, age, vehicle, coverage limits, deductibles, and insurer can all change the answer.
National figures are useful starting points. They can show why a state-minimum policy generally costs less than one that also insures damage to your own car, and why prices differ across locations and age groups. They cannot tell you what an insurer will charge you. Even reputable studies may report different numbers because they use different drivers, cars, limits, deductibles, and statistical methods.
This guide presents clearly labeled 2026 benchmarks, explains the protections behind them, and shows how to compare quotes fairly. Use the tables to plan a budget—not as substitutes for personalized prices.
National costs and coverage
Average car insurance cost in 2026
NerdWallet’s September 2026 analysis reports national median annual rates of $644 for state-minimum coverage and $2,344 for full coverage. Dividing those annual amounts by 12 gives approximate monthly equivalents of $54 and $195, respectively. A monthly equivalent is a budgeting calculation; actual installment payments may include fees or follow a different schedule.nerdwallet
| Coverage type | Annual premium | Approximate monthly equivalent | Source and methodology |
|---|---|---|---|
| State-minimum coverage | $644 | $54 | NerdWallet, September 2026; national median rate for required coverage under each state’s rules nerdwallet |
| Full coverage | $2,344 | $195 | NerdWallet, September 2026; national median rate for its specified full-coverage policy nerdwallet |
NerdWallet used Quadrant Information Services rate data across ZIP codes in the 50 states and Washington, D.C. Its base profile is a 35-year-old driver with good credit and a clean record, driving a 2023 Toyota Camry LE for 12,000 miles a year. Full coverage includes $100,000/$300,000 bodily injury liability, $50,000 property damage liability, $100,000/$300,000 uninsured motorist bodily injury protection, and $1,000 collision and comprehensive deductibles, with required additional state coverages where applicable. These are modeled median rates, not average amounts actually paid by policyholders.nerdwallet
For context, Insurance.com’s separately conducted 2026 analysis reports average annual rates of $738 for state minimum and $2,578 for full coverage—about $62 and $215 per month. Its core full-coverage profile instead uses a 40-year-old driver, a Honda Accord LX, 10,000 annual miles, 100/300/100 liability limits, and $500 deductibles. Those figures should not be placed in the NerdWallet table as though they came from the same model.insurance
Minimum coverage vs. full coverage
A state-minimum policy contains the coverage and limits needed to meet that state’s insurance requirements. Most states require bodily injury and property damage liability: these help pay eligible injuries and property damage you cause to others, up to policy limits. Some states require additional protection, such as personal injury protection (PIP) or uninsured motorist coverage.
Full coverage is an informal term. It usually means required coverage plus collision, which helps with covered crash damage to your car, and comprehensive, which helps with specified non-collision losses such as theft, fire, or hail. A deductible generally applies to each of those vehicle coverages. The term does not guarantee that every loss or optional benefit is included.
| Protection | Typical state-minimum policy | Common full-coverage package |
|---|---|---|
| Bodily injury liability | Included where required, at state-required limits | Included; buyer may select higher limits |
| Property damage liability | Included where required, at state-required limits | Included; buyer may select higher limits |
| Damage to your car in a covered collision | Generally not included | Generally addressed by collision, less deductible |
| Theft or specified weather damage to your car | Generally not included | Generally addressed by comprehensive, less deductible |
| Uninsured motorist, PIP, or medical payments | Depends on state requirements and choices | Depends on state requirements and choices |
NerdWallet’s $644 and $2,344 figures reflect different liability limits as well as different vehicle coverages. Their difference is not a controlled estimate of what adding only collision and comprehensive would cost. Request both options with identical liability limits to learn your own incremental price.nerdwallet
Costs by location and driver
Car insurance cost by state
State comparisons are most useful when they come from one study. The selection below uses NerdWallet’s September 2026 median annual rates for its specified 35-year-old driver profile. Minimum-coverage packages still differ because each state sets its own requirements. For the full list of 50 states and Washington, D.C., see NerdWallet’s state table.nerdwallet
| State | Full coverage, annual median | State minimum, annual median | Source and data date |
|---|---|---|---|
| Wyoming | $1,148 | $192 | NerdWallet, September 2026 nerdwallet |
| Vermont | $1,463 | $429 | NerdWallet, September 2026 nerdwallet |
| California | $1,931 | $608 | NerdWallet, September 2026 nerdwallet |
| Florida | $3,295 | $854 | NerdWallet, September 2026 nerdwallet |
| Texas | $3,608 | $1,075 | NerdWallet, September 2026 nerdwallet |
| New Jersey | $3,664 | $1,597 | NerdWallet, September 2026 nerdwallet |
| Louisiana | $4,296 | $1,256 | NerdWallet, September 2026 nerdwallet |
Under this study’s full-coverage assumptions, Wyoming has the lowest state median at $1,148 and Louisiana the highest at $4,296. That statement does not mean every Louisiana driver pays more than every Wyoming driver. Nor should Wyoming’s $192 minimum-coverage figure be read as the price of buying New Jersey’s minimum-required protections in Wyoming.nerdwallet
Differences can reflect state insurance rules, traffic and crash patterns, theft and weather-related claims, vehicle repair costs, medical and legal costs, and insurers’ local pricing. Rates also vary within a state: a driver’s ZIP code and garaging location can produce a quote above or below its statewide figure.
Another publication may identify a different cheapest state because it uses a different sample. Insurance.com, for example, reports Vermont as lowest for its 2026 full-coverage profile. The two findings are not necessarily contradictory; they answer questions using different drivers, vehicles, coverage, deductibles, and measures of central tendency.
How costs change with age
Driving experience is an important pricing consideration, subject to applicable state rating rules. NerdWallet’s September 2026 analysis provides the following national median rates by age using its stated coverage framework and changing the driver’s age. It studied selected ages, not every birthday or requested age band.nerdwallet
| Driver age | Full coverage, annual median | State minimum, annual median |
|---|---|---|
| 20 | $4,741 | $1,337 |
| 30 | $2,417 | $660 |
| 35 | $2,344 | $644 |
| 40 | $2,277 | $629 |
| 50 | $2,112 | $591 |
| 60 | $2,028 | $586 |
| 70 | $2,161 | $658 |
All age figures: NerdWallet, September 2026. Drivers have good credit and clean records under the study’s assumptions; minimum coverage follows each state’s requirements.nerdwallet
A 20-year-old’s modeled full-coverage median is higher than a 35-year-old’s, but the table does not say what a particular family would pay to add a teen to an existing policy. A standalone young-driver policy and an increased household premium are different measures. Insurance.com offers separate teen-driver examples, but combining them into this table would mix methodologies.
The figures also do not imply that premiums fall every year until a set birthday or rise automatically at 65. A driver’s claim record, insurer, vehicle, location, and selected coverage can change in the meantime. For any age group, obtain a quote for the actual household and cars.
Costs for different driving records
To isolate common profile differences, NerdWallet’s September 2026 analysis changes the relevant driving- or credit-history assumption from its 35-year-old, good-credit, clean-record baseline. Its hypothetical at-fault crash involved $10,000 in property damage and no injuries; its speeding example used 16 mph over the limit. These are modeled national medians for full coverage, not forecasts of how much your renewal will increase.nerdwallet
| Driver profile | Full-coverage annual median |
|---|---|
| Clean record, good credit | $2,344 |
| One speeding ticket, good credit | $3,019 |
| One at-fault crash, good credit | $3,504 |
| One DUI, good credit | $4,433 |
| Clean record, poor-credit approximation | $3,929 |
Source: NerdWallet, September 2026. The poor-credit comparison uses score approximations, not every insurer’s proprietary credit-based insurance score; credit use is restricted in some states.
A ticket, accident, or DUI may also affect eligibility for a discount, but actual effects differ by state and insurer. A driver with little insurance or driving history, or a household adding a teen, needs a separate quote rather than an adjustment to these figures. Do not apply the national differences as fixed surcharges.
Why your quote differs
Factors affecting car insurance rates
Insurers assess multiple sources of potential claims and the cost of paying them. Their methods vary, and states restrict certain rating factors. The most relevant questions for your own estimate include:
- Where is the car kept? State rules and local accident, theft, weather, repair, and medical costs can affect rates; ZIP codes within one state can differ.
- Who drives it? Experience, violations, at-fault accidents, claims, and listed household drivers may matter under applicable law.
- What vehicle is insured? Make, model, trim, age, market value, parts, and repair costs affect potential claim expense.
- How is it used? Annual mileage, commuting, and business-related use can change a quote.
- What protection did you select? Liability limits, collision and comprehensive, optional coverages, and deductibles shape both premium and potential out-of-pocket expense.
- Which insurer is quoting? Approved rates, underwriting practices, and eligible discounts differ.
- Is credit information permitted? Credit-based insurance scores may affect pricing in some states, while other states prohibit or restrict their use.
For example, two neighbors with identical cars could receive different quotes if one has a recent at-fault accident or chooses a $500 collision deductible while the other chooses $1,000. Your premium is a price for a specific policy and profile, not a local average with a small personal adjustment.
Does vehicle type change the price?
It can, but broad labels such as “SUV” or “sedan” are poor price predictions. Insurers consider the actual vehicle’s value, repair methods, replacement parts, safety-related features, theft experience, and claim costs. A luxury sedan may cost more to insure than a mainstream SUV; a performance model may differ sharply from another car of the same body style.
The same reasoning applies to pickup trucks and electric vehicles. Specialized parts or repairs may affect some EV quotes, but not every EV is more expensive to insure than every gasoline-powered vehicle. An older, low-value car can reduce the financial case for collision or comprehensive, but liability costs and your driver profile still matter.
Before choosing a car, obtain insurance quotes for its exact year, make, model, and trim. Compare each candidate under the same limits and deductibles. An insurance estimate made before purchase is more useful than assuming a vehicle category will be cheap.
Monthly, six-month, and annual costs
A premium is the price of your policy for its coverage period. Many auto policies run for six or twelve months, while insurers may let you pay in monthly installments or in full. Paying monthly does not necessarily mean you bought month-to-month insurance. Your declarations page states when coverage begins and ends.
An annual rate divided by 12 is a helpful monthly equivalent, but it may not equal your billed monthly payment. Installment fees, the initial payment, taxes or other permitted charges, and payment timing can change the schedule. Paying in full may qualify for savings with some insurers, but ask for both totals rather than assuming.
If one quote says “$180 per month” and another “$1,050 for six months,” convert both to the same policy period and check fees before comparing them. Also match the coverage: a lower monthly payment could mean a higher deductible or weaker liability limits.
Choosing a policy and price
How much coverage do you need?
Begin with your state’s minimum requirements, then consider whether those liability limits would protect you adequately after a serious accident. Your income, assets, financial obligations, driving exposure, and budget can inform the choice. The cheapest legal package is not automatically suitable for every driver, though no one coverage package fits everyone.
Next, decide whether to insure damage to your own car. Collision and comprehensive may be especially relevant for a newer or higher-value vehicle, or when paying for replacement would strain your savings. A lender or lessor commonly requires those coverages on a financed or leased car. For an older paid-off car, compare the additional premium, deductible, and potential claim payment with its current value.
Review uninsured or underinsured motorist coverage, PIP, and medical payments according to your state’s rules and circumstances. Choose deductibles you could pay soon after a covered loss. A licensed insurance professional can explain policy-specific options; ask them to show the price and protection at more than one limit level.
How to lower costs in 2026
Look for savings that do not create an unacceptable financial gap:
- Request quotes from several insurers with matching coverage.
- Ask about safe-driver, multi-policy, multi-vehicle, good-student, and other eligible discounts.
- Check low-mileage or usage-based programs if they fit your driving and data-sharing preferences.
- Verify your annual mileage, vehicle use, and listed drivers are accurate.
- Price higher collision or comprehensive deductibles only if you could afford them after a claim.
- Review whether optional benefits overlap with protection you already have.
- Reassess vehicle-damage coverage as a paid-off car’s value changes.
- Shop again at renewal or after a move, new vehicle, or household-driver change.
Maintaining a safe driving record can help over time, but no discount or switching strategy guarantees a lower quote. Do not remove important liability protection solely to reach a target monthly payment. If bundling looks attractive, compare the combined auto and home or renters cost against buying separately.
Compare quotes fairly
Give each insurer identical vehicle, driver, address, and mileage details. Match bodily injury and property damage liability limits, then collision and comprehensive choices and their deductibles. Include the same uninsured or underinsured motorist protection, PIP or medical payments, and optional rental or roadside benefits where relevant.
Check policy terms, discounts actually applied, and the total price over the same six- or twelve-month period, including payment charges. A quote with a higher deductible can be cheaper to buy but more expensive to use after a claim. Before purchasing, review the insurer’s claims and complaint information and verify the final declarations page matches what you requested. The NAIC provides consumer tools for researching insurance companies and contacting state regulators.
Estimating mistakes to avoid
Do not treat a national median as your personalized quote, or mix it with another publication’s average and call the difference a rate increase. Never compare state minimum with full coverage as though only one coverage changed: liability limits, required state benefits, and deductibles may also differ.
Check whether a figure is annual, six-month, monthly equivalent, or an actual installment. Look for the publication date, driver and vehicle profile, limits, and deductibles. Watch for fees and missing discounts. Above all, resist choosing a policy on price alone: what it pays after a loss matters as much as the amount due today.
Frequently asked questions
How much does car insurance cost per month in 2026?
NerdWallet’s September 2026 median annual rates work out to about $54 per month for state-minimum coverage and $195 for full coverage. The study models a 35-year-old driver with good credit and a clean record; its full-coverage package has specified limits and $1,000 vehicle-damage deductibles. These are monthly equivalents, not guaranteed installment bills.nerdwallet
What is the average annual cost of full coverage?
Insurance.com’s 2026 average is $2,578 annually, using 100/300/100 liability limits and $500 collision and comprehensive deductibles for its core 40-year-old driver profile. NerdWallet’s different September methodology yields a median of $2,344. Both are benchmarks; your coverage, driver profile, vehicle, and state can produce a different quote.
Is minimum coverage cheaper than full coverage?
Generally, yes. NerdWallet reports $644 annually for state minimum versus $2,344 for its full-coverage package. But these packages differ in liability limits and vehicle protection, so the difference is not simply the price of adding collision and comprehensive. Ask for matched-limit quotes to see that additional cost for you.nerdwallet
Which states have the highest and lowest costs?
In NerdWallet’s September 2026 state medians for its full-coverage profile, Louisiana is highest at $4,296 annually and Wyoming lowest at $1,148. Rankings can change with a different study, coverage definition, or driver. A state figure also cannot predict a particular ZIP code or household premium.nerdwallet
Why is my quote above the national figure?
You may live in a higher-cost area, insure a more expensive vehicle, select different limits or deductibles, or have a different driving or claims history than the modeled driver. Insurers also price the same profile differently. Compare your quote with like-for-like alternatives, not just a national figure.
How can I lower my premium?
Compare several insurers with identical protection. Ask about discounts you qualify for, verify mileage and household details, and consider deductible alternatives you could pay after a loss. Recheck coverage at renewal, especially after life or vehicle changes. Savings vary; a cheaper premium should not leave you with a loss you cannot afford.
Does age affect car insurance cost?
It can, subject to state rating rules and each insurer’s practices. NerdWallet’s September 2026 full-coverage median is $4,741 for a 20-year-old and $2,344 for a 35-year-old under its modeled assumptions. Those are different age profiles, not a promise that your premium will fall by a particular amount on a birthday.nerdwallet
Conclusion
How much does car insurance cost in the USA in 2026? NerdWallet’s September analysis puts the national median at $644 annually for state minimum and $2,344 for full coverage, or roughly $54 and $195 in monthly equivalents. Insurance.com’s differently modeled averages are higher, illustrating why methodology matters.
Your actual premium depends on location, age and driving history, vehicle, selected coverage, deductibles, permitted credit-related factors, and insurer. Use averages for planning, not as a promised price. Before buying or renewing, request several personalized quotes with matching limits and deductibles and compare the total policy-period cost.